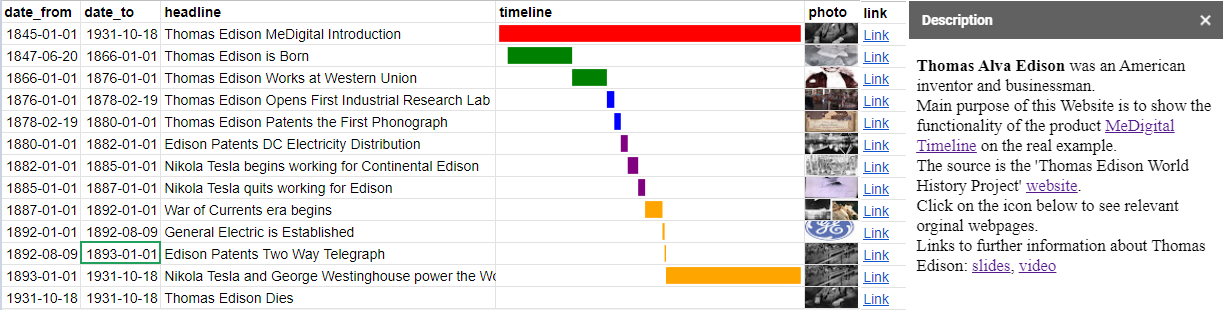
Thomas Edison’s Life Graphical
Gannt diagram shows proportional line graph depending on the length of the particular event. By clicking on the Description button the full contents of the description field appears in the right window with full html support.